 AI Infographic Maker
How to Turn a PDF into an Infographic (Fast)
Turn a report, research paper, or slide deck PDF into a clean infographic — how to pull out the key points and lay them out without manual design.
Published August 11, 2026
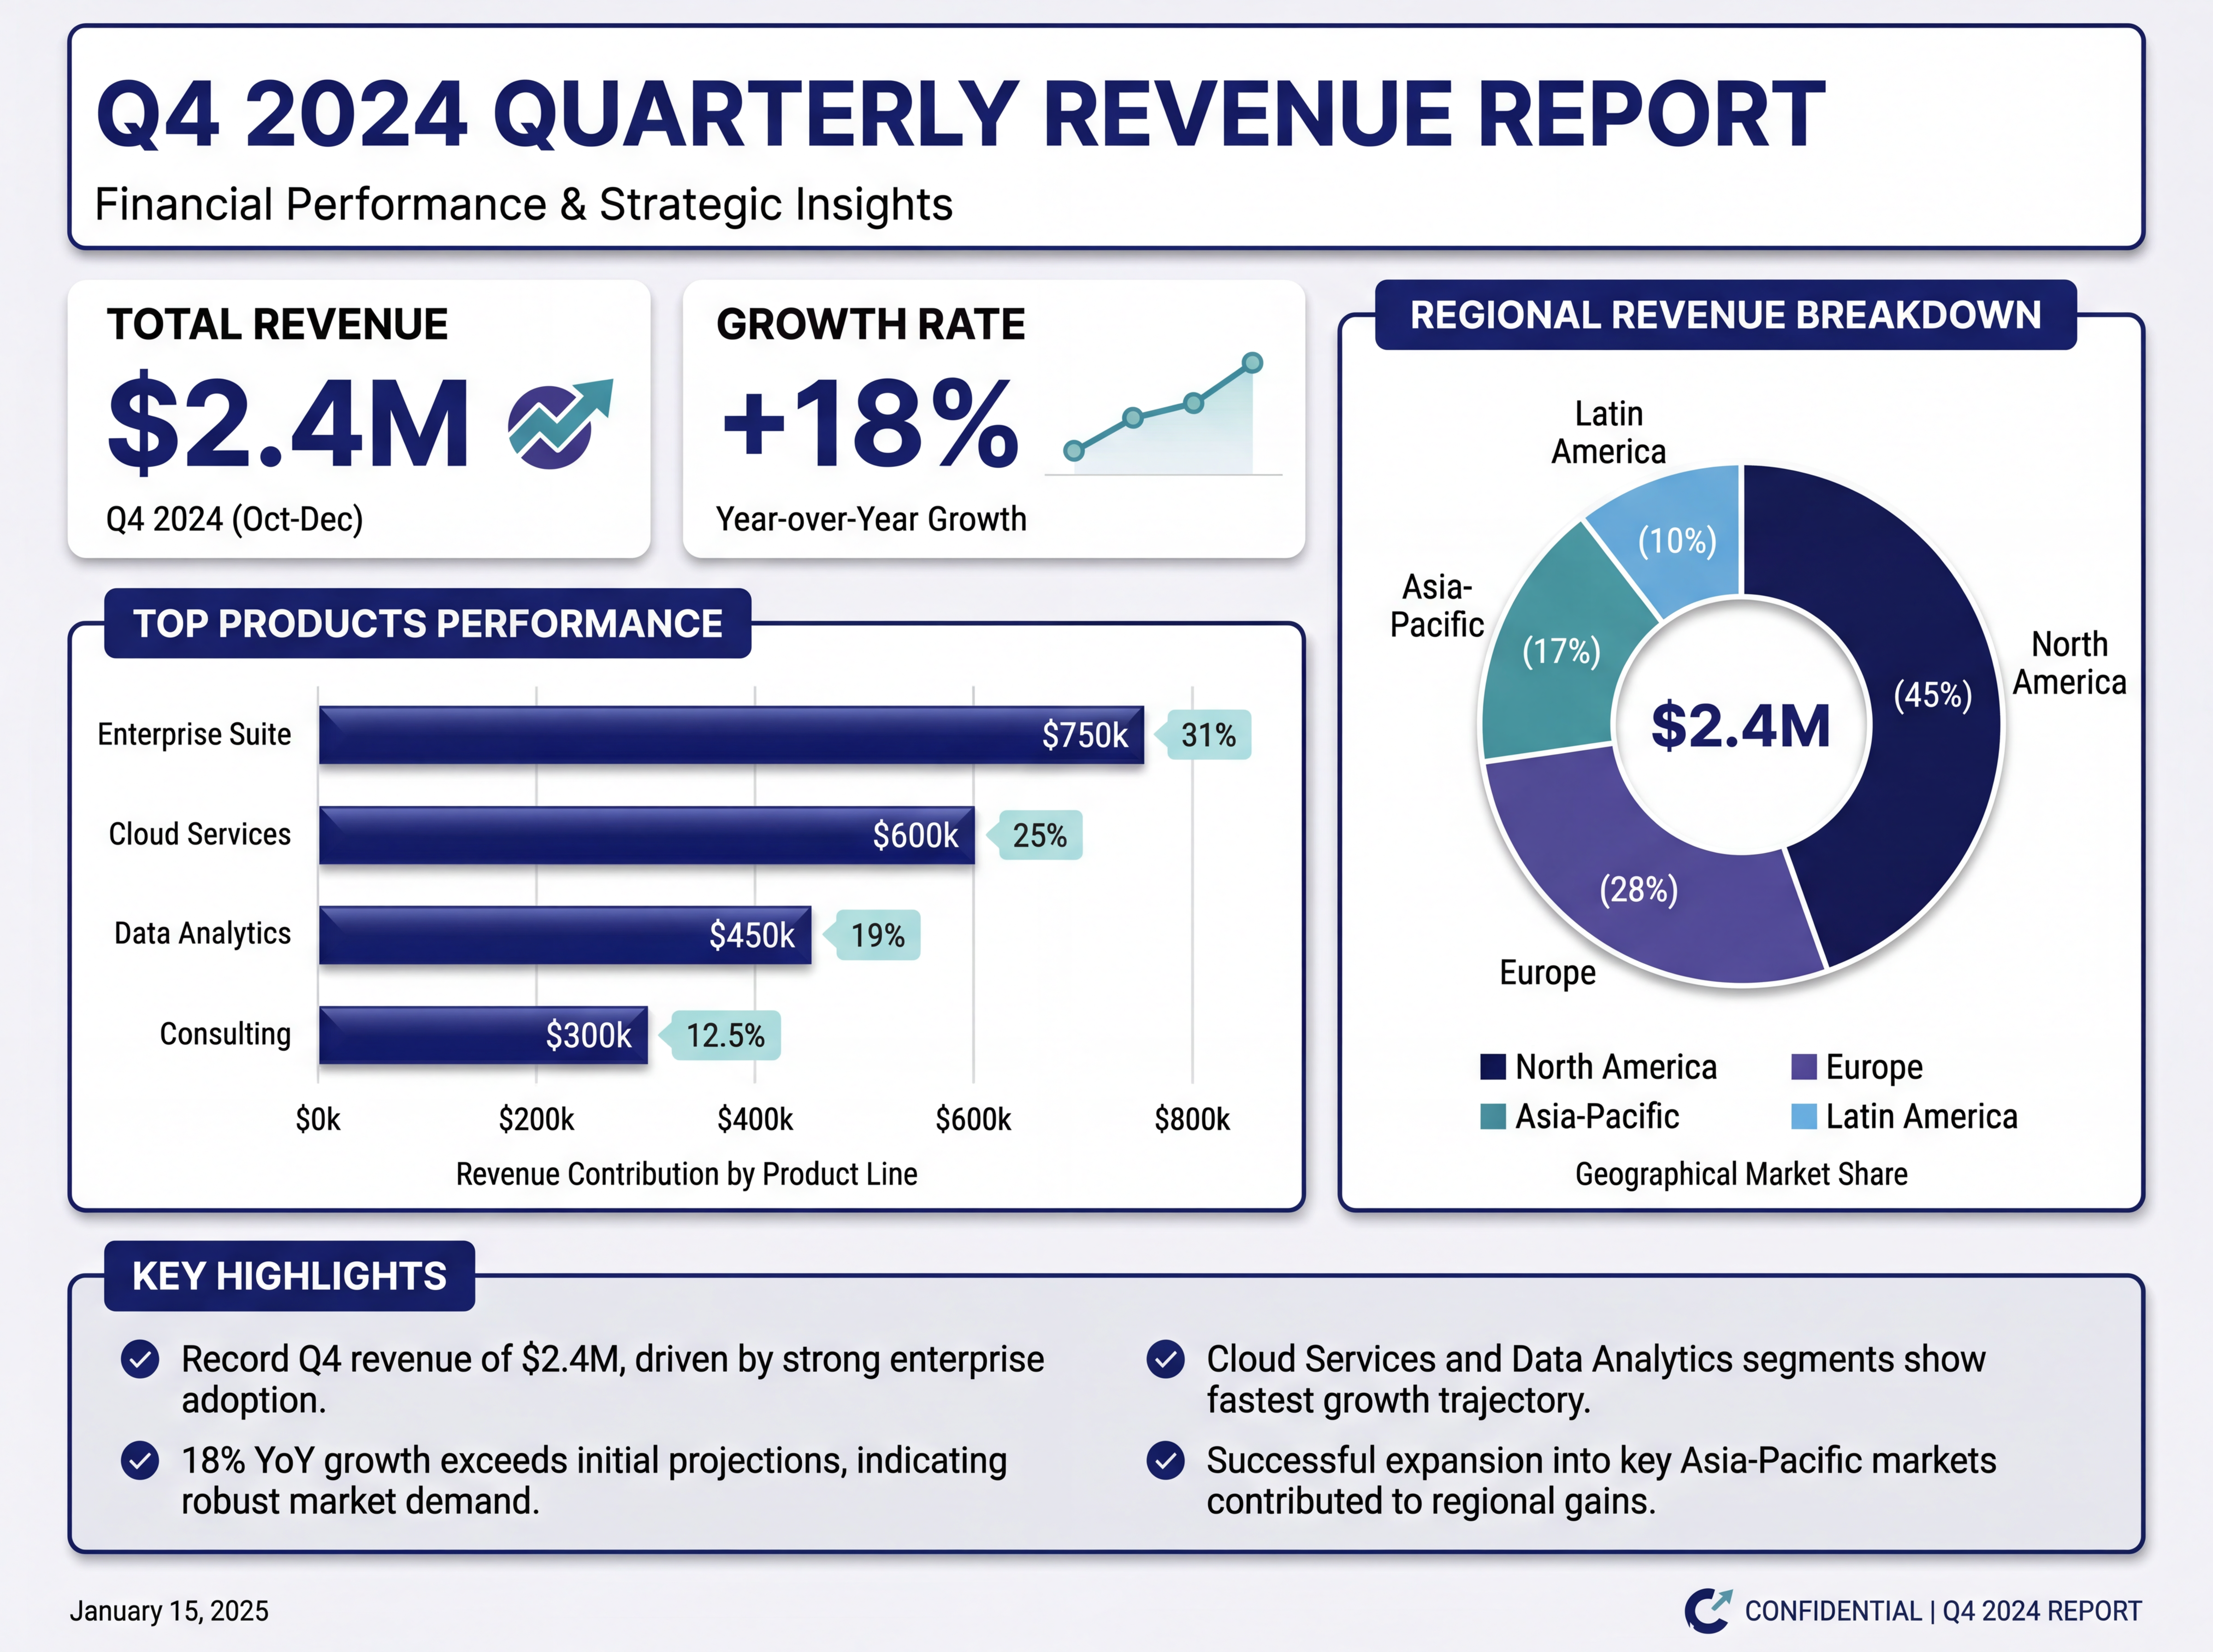
Yes — you can turn a PDF straight into an infographic. Upload the file, let the AI extract and summarize the key points, pick a style, and generate. The hard part of "PDF to infographic" isn't the design; it's deciding what to keep. This guide covers how to get a clean, readable result instead of a cluttered one.
Why most PDF-to-infographic attempts fail
A report or paper has far more text than an infographic can hold. If you dump the whole thing in, you get an unreadable wall of small type. The goal is the opposite of the source document: one clear takeaway, a handful of supporting points, and lots of breathing room.
What to keep (and what to cut)
- Keep: the headline finding, 3–6 key stats or points, and one conclusion.
- Cut: methodology detail, long explanations, references, and anything that isn't the "so what".
- Rule of thumb: if a point wouldn't make sense as a single line on a slide, it doesn't belong.
Step by step
- Upload the PDF. The text is extracted automatically.
- Let AI summarize the key points so you start from the essentials, not the full document.
- Pick a style and aspect ratio that fit where it'll live (a report slide, a LinkedIn post, a handout).
- Generate, then refine wording or emphasis with Smart Edit.
- Download in HD and drop it into your deck, post, or doc.
Good use cases
- Research papers → a one-image summary of the finding.
- Quarterly reports → a shareable stat card for stakeholders.
- Slide decks → a single recap graphic for social or email.
Start from the summary, not the full document, and the design takes care of itself.